Sampled Values
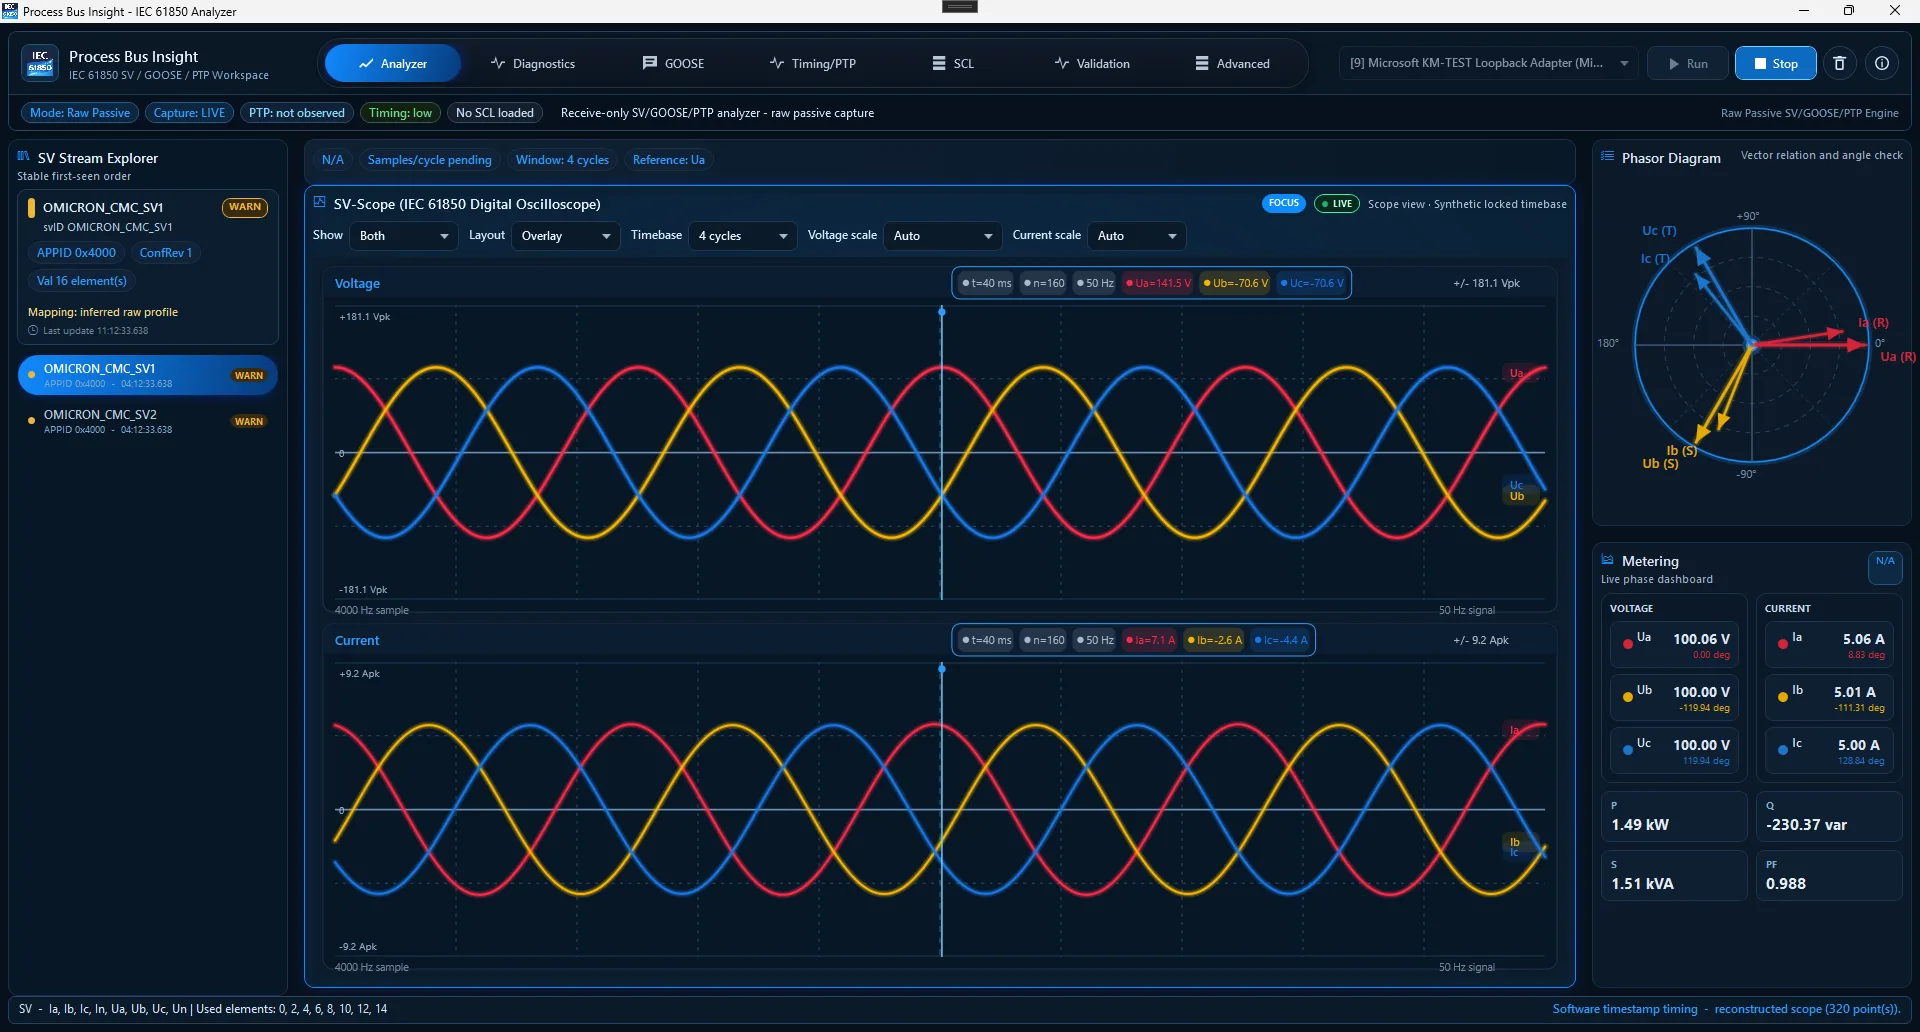
Stream identity, APPID, svID, VLAN, continuity, waveform, RMS, phasor, and sequence context.
Analyze live Sampled Values, GOOSE, PTP timing context, and SCL expected-vs-observed evidence. Reproduce sanitized classic PCAP captures through the same decoder path while keeping timing and evidence limitations visible.
 fullscreen Preview
Use an authorized observation path. Npcap is installed separately only when live raw Ethernet capture is required.
The application shortens the path from traffic to a reviewable finding without treating software capture as certified metrology.
Stream identity, APPID, svID, VLAN, continuity, waveform, RMS, phasor, and sequence context.
Publisher state, stNum, sqNum, dataset values, and event changes.
Timing traffic and freshness with explicit timestamp-source limits.
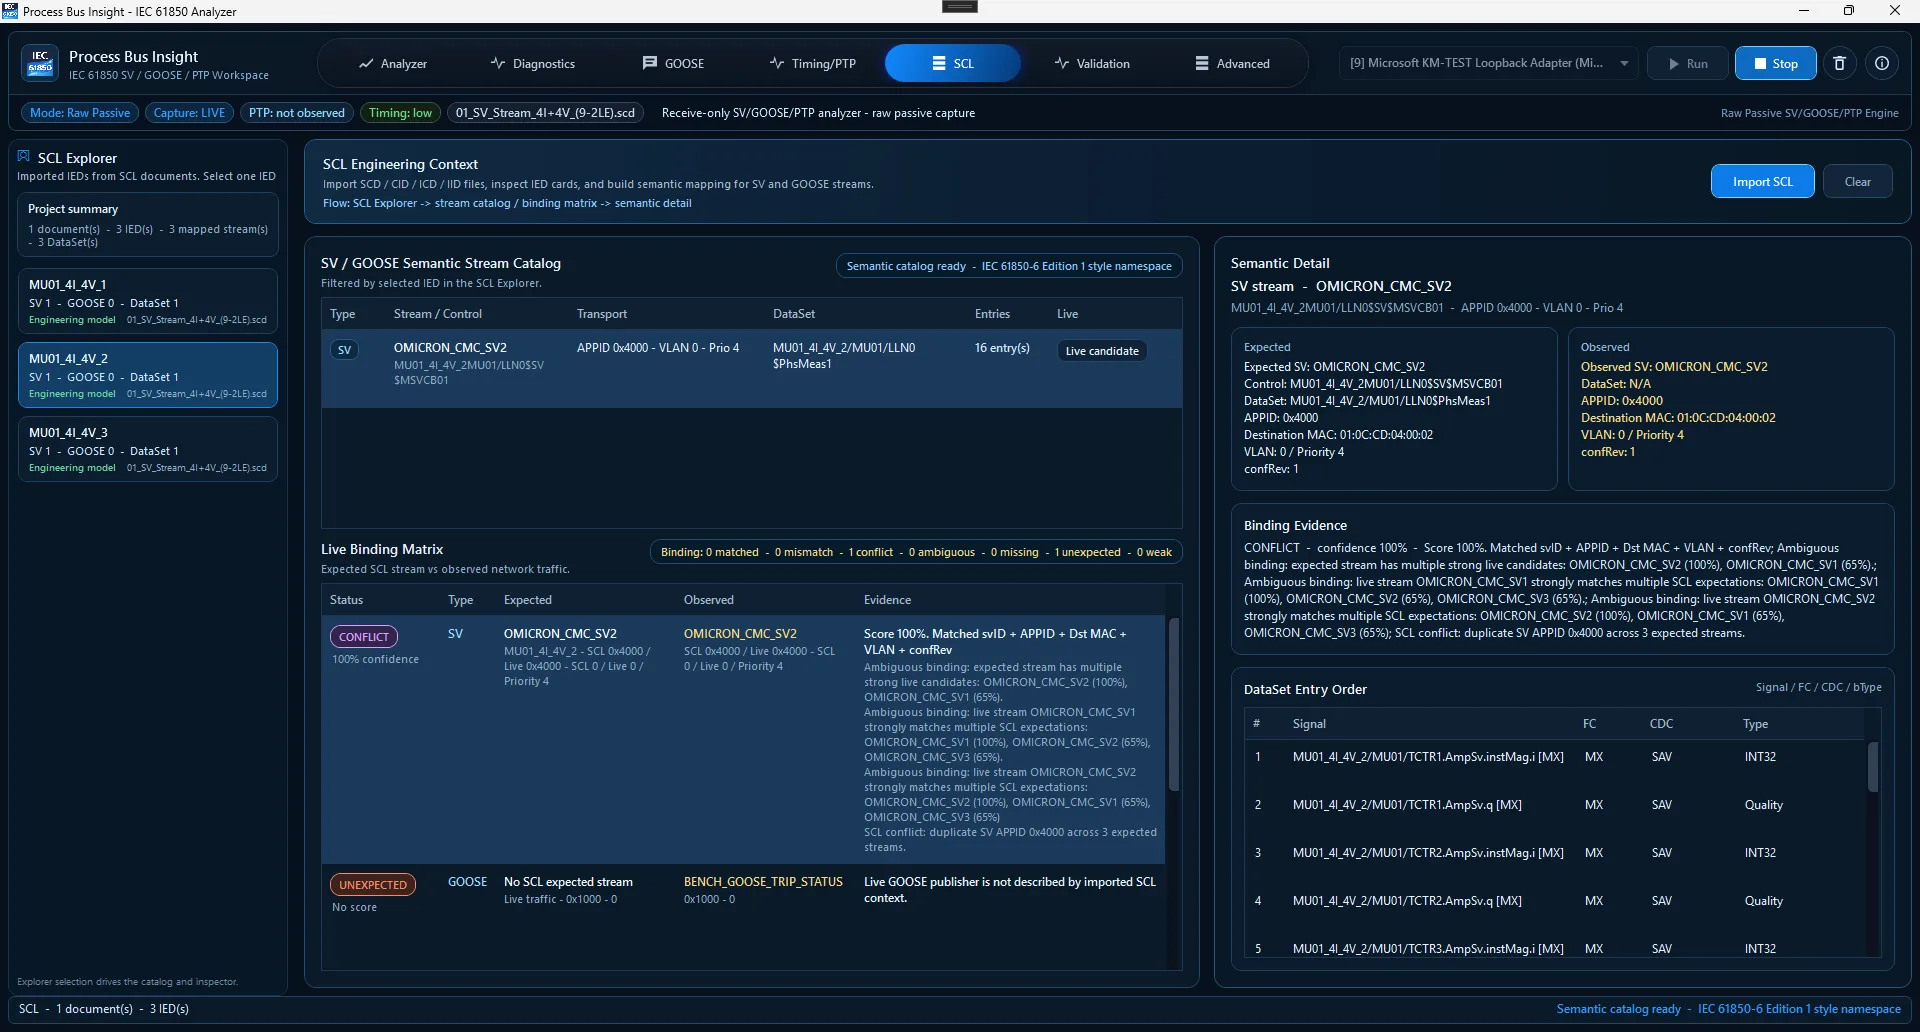
Compare observed traffic with SCD, ICD, or CID expectations.
Reproduce sanitized classic Ethernet captures through the live decoder path.
No SV or GOOSE publishing and no IEC 61850 control-command path.
TAP, mirror port, or controlled engineering switch.
Identify stream, publisher, VLAN, APPID, timing context, and capture health.
Load SCL expectations or reproduce sanitized traffic offline.
State what was expected, observed, decoded, and not proven.
 fullscreen Preview
Post-transition source and packages are GPL-3.0-or-later only. Historical Apache-2.0 grants remain attached to the revisions and artifacts to which they originally applied.
Use, study, modify, and redistribute under GPL-3.0-or-later and its conditions.
Apache-2.0 ends at 85d43a0fe58a5888a9e8008c168ab76d2333ea87, preserved on archive/apache-2.0-final. Historical v1.4.0-beta.1 artifacts remain historical; this is not a current dual-license offer.
Proprietary integration, OEM/white-label, closed-source redistribution, private branches, or contractual services require a separate commercial agreement. The notice grants no additional rights by itself.
No. It is receive-only and does not publish SV/GOOSE or send IEC 61850 control commands.
No. Ordinary Windows/Npcap and replay timestamps are screening evidence, not calibrated timing proof.
No. External IED reception, trust, and process action require separate evidence.
A separate commercial agreement may be negotiated for rights controlled by the project owner. The repository notice is not itself a commercial license.